Time Series Spectrograms and Plot Box Management
Added by Joey M about 12 years ago
Has there been any progress with creating time-series spectrograms from Wt? I saw some activity with it three years ago by Thomas Suckow, but nothing more recently. Has it fallen away?
Currently, I use Qwt in my program and would love to put it on the web. My program is such that I could embed the Wt library and recreate the plots in Wt if it were possible to make spectrograms with Wt.
The other thing I would like would be the ability to have multiple plots arranged (say four to a page?). Does Wt's API offer any kind of plot box management such that I could align plots next to one another, sharing axes and what not?
BTW, the existing library looks fantastic! I haven't played with Wt since I really need the above to be productive, but everything else looks really nice.
Thanks,
joey
Replies (3)
RE: Time Series Spectrograms and Plot Box Management - Added by Wim Dumon about 12 years ago
Hello Joey,
Can you send me a screenshot (or a link) to what you mean with a time-series spectrogram? Just to make sure we're talking about the same thing.
Wrt to box-plots: that's a feature we'll add when there is a commercial project that requires it.
Best regards,
Wim.
RE: Time Series Spectrograms and Plot Box Management - Added by Joey M about 12 years ago
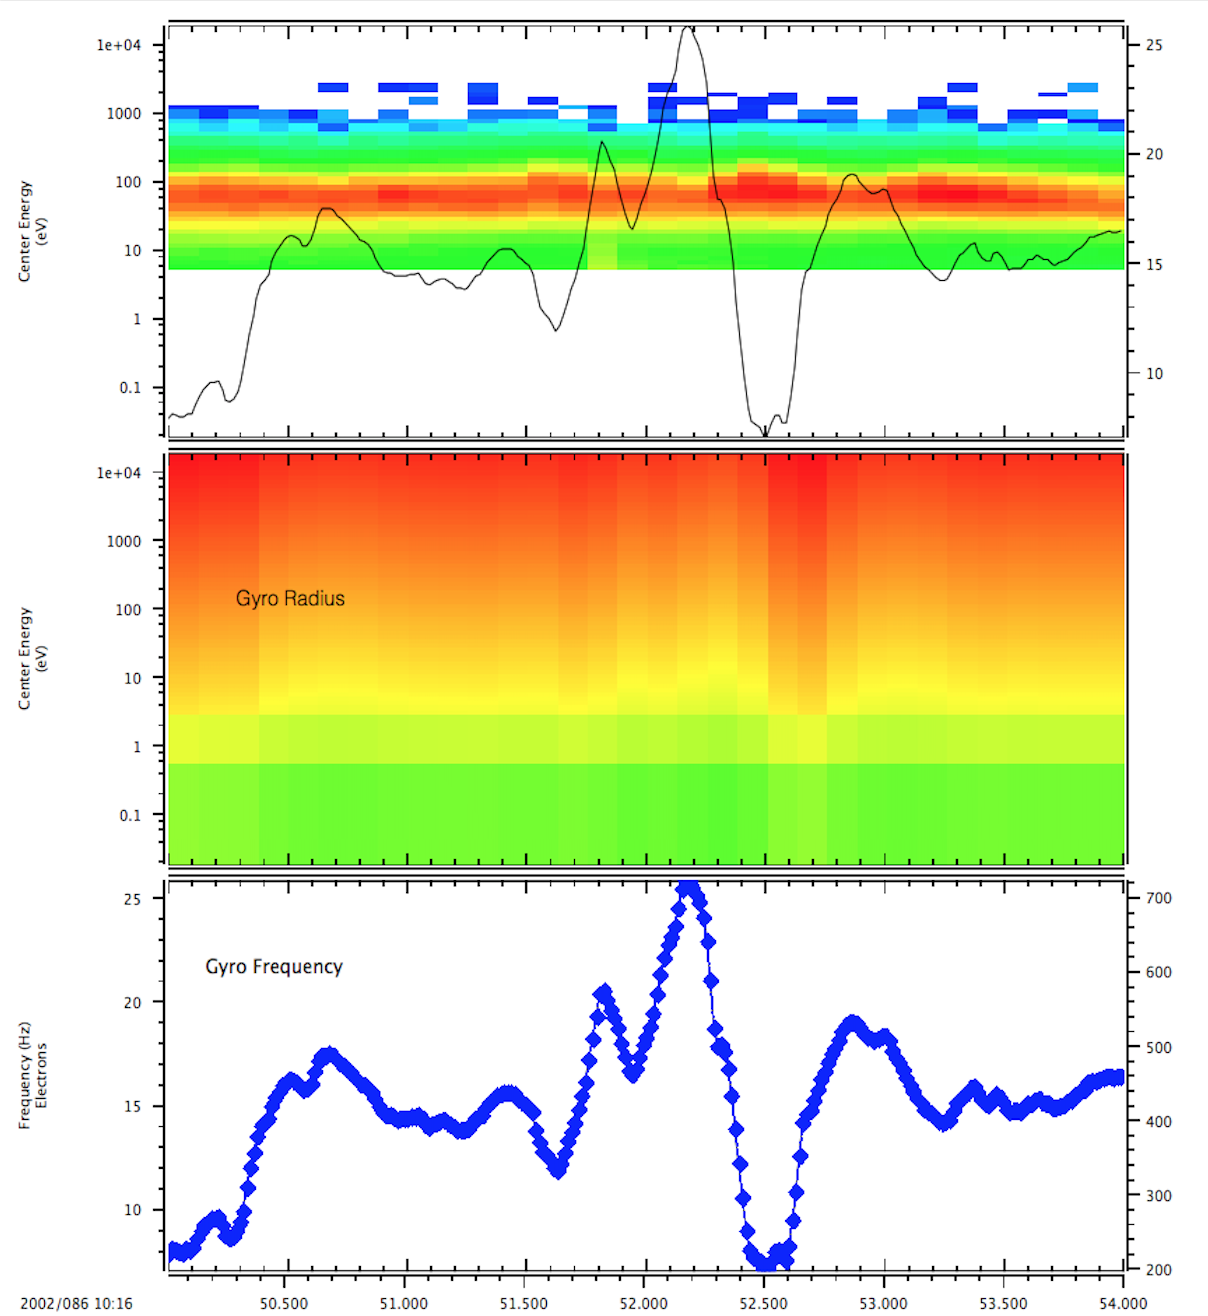
Certainly! The top two boxes are examples of plots that I am trying to create on the web. All of these graphics were created with Qwt. I'd be happy with just one box if the box management stuff is too consuming. The other thing that I'd like to handle not shown in this plot is data gaps.
Best,
Joey
RE: Time Series Spectrograms and Plot Box Management - Added by Koen Deforche about 12 years ago
Hey Joey,
A do-it-yourself approach to the spectogram rendering would be to specialize WCartesianChart::renderBackground() and paint the spectogram there. That circumvents the issue of how to represent the spectral data as a WDataSeries, and also gives flexibility on how to provide the data.
You can use WCartesianChart::map() to obtain coordinates for logical values.
It's not clear in advance how performant client-side rendering versus server-side rendering would be, but you can easily switch the chart to render to a PNG image if needed.
Regards,
koen