JNMissing curve lines on Scatter plot. Time series
Added by Joseph Nalluri about 11 years ago
Hello,
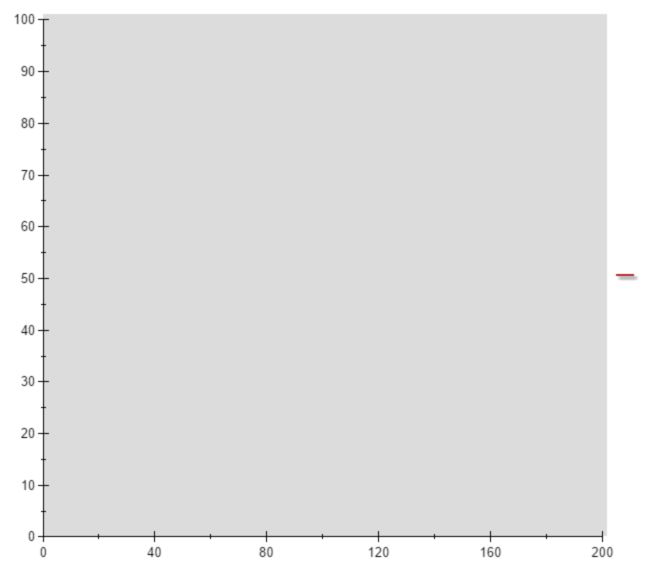
I am trying to implement a scatterplot. However, I can see the (screenshot attached), but not the curve lines. The server console is not showing up any errors. Here is my code as below:
Wt::WWidget* ChartExp::ChartView(Wt::WContainerWidget* w){
Wt::WContainerWidget* c = new Wt::WContainerWidget(w); Wt::WStandardItemModel* model = new Wt::WStandardItemModel(c); for (int row = 0; row < 100; row++)
{ model->setData(row, 0, row); model->setData(row, 1, row*2); }
@
Wt::Chart::WCartesianChart *chart = new Wt::Chart::WCartesianChart();
chart->setBackground(Wt::WColor(220, 220, 220));
chart->setModel(model);
chart->setXSeriesColumn(1);
chart->setLegendEnabled(true);
chart->setType(Wt::Chart::ScatterPlot);@
Wt::Chart::WDataSeries y_series(2, Wt::Chart::LineSeries); y_series.setShadow(Wt::WShadow(3, 3, Wt::WColor(0, 0, 0, 127), 3)); chart->addSeries(y_series); chart->resize(800, 300); chart->setMargin(Wt::WLength::Auto, Wt::Left | Wt::Right); return chart; }
Am I missing something? In the 'Examples' files of Scatter plot I see a file 'ChartConfig.h' and 'ChartConfig.c', but on the widgetGallery webpage (http://www.webtoolkit.eu/widgets/graphics-charts/scatter-plot), I don't see that config details.
Thanks
Replies (2)
BT RE: Missing curve lines on Scatter plot. Time series - Added by Bruce Toll about 11 years ago
It looks like you may have set the column indexes incorrectly on the WDataSeries. The column indexes are zero-based (like the model).
JN RE: Missing curve lines on Scatter plot. Time series - Added by Joseph Nalluri about 11 years ago
You were right! Silly me!
Thanks again! It worked.