2D plot of 3D data (pseudocolor plots)
Added by Alexandra S over 5 years ago
I'm currently looking into Wt for one of our projects. The data (x,y,intensity) generated from the user inputs is to be displayed as 2D pseudocolor plots. One way to do it, is to use WCartesian3DChart and look at it from above. But that seems like a lot of unnecessary overhead.
Also, at a second stage of the project, we would like to plot data (r,phi,intensity) in radial pseudocolor plots (eventually also as overlays on a map).
So I assume, the right way would be to develop a new class? Would that class have to inherit from WAbstractChart?
I would be grateful for any help that points me in the right direction.
Replies (10)
RE: 2D plot of 3D data (pseudocolor plots) - Added by Roel Standaert over 5 years ago
Do you have some screenshots (e.g. from other libraries) that show what you're looking for? I imagine there are ways to do the 2D pseudocolor plot with WCartesianChart, but it seems to me that maybe the radial pseudocolor plot is too different from what WCartesianChart has to offer. If it's really too different, you may be better off implementing it with WPaintedWidget.
RE: 2D plot of 3D data (pseudocolor plots) - Added by Alexandra S over 5 years ago
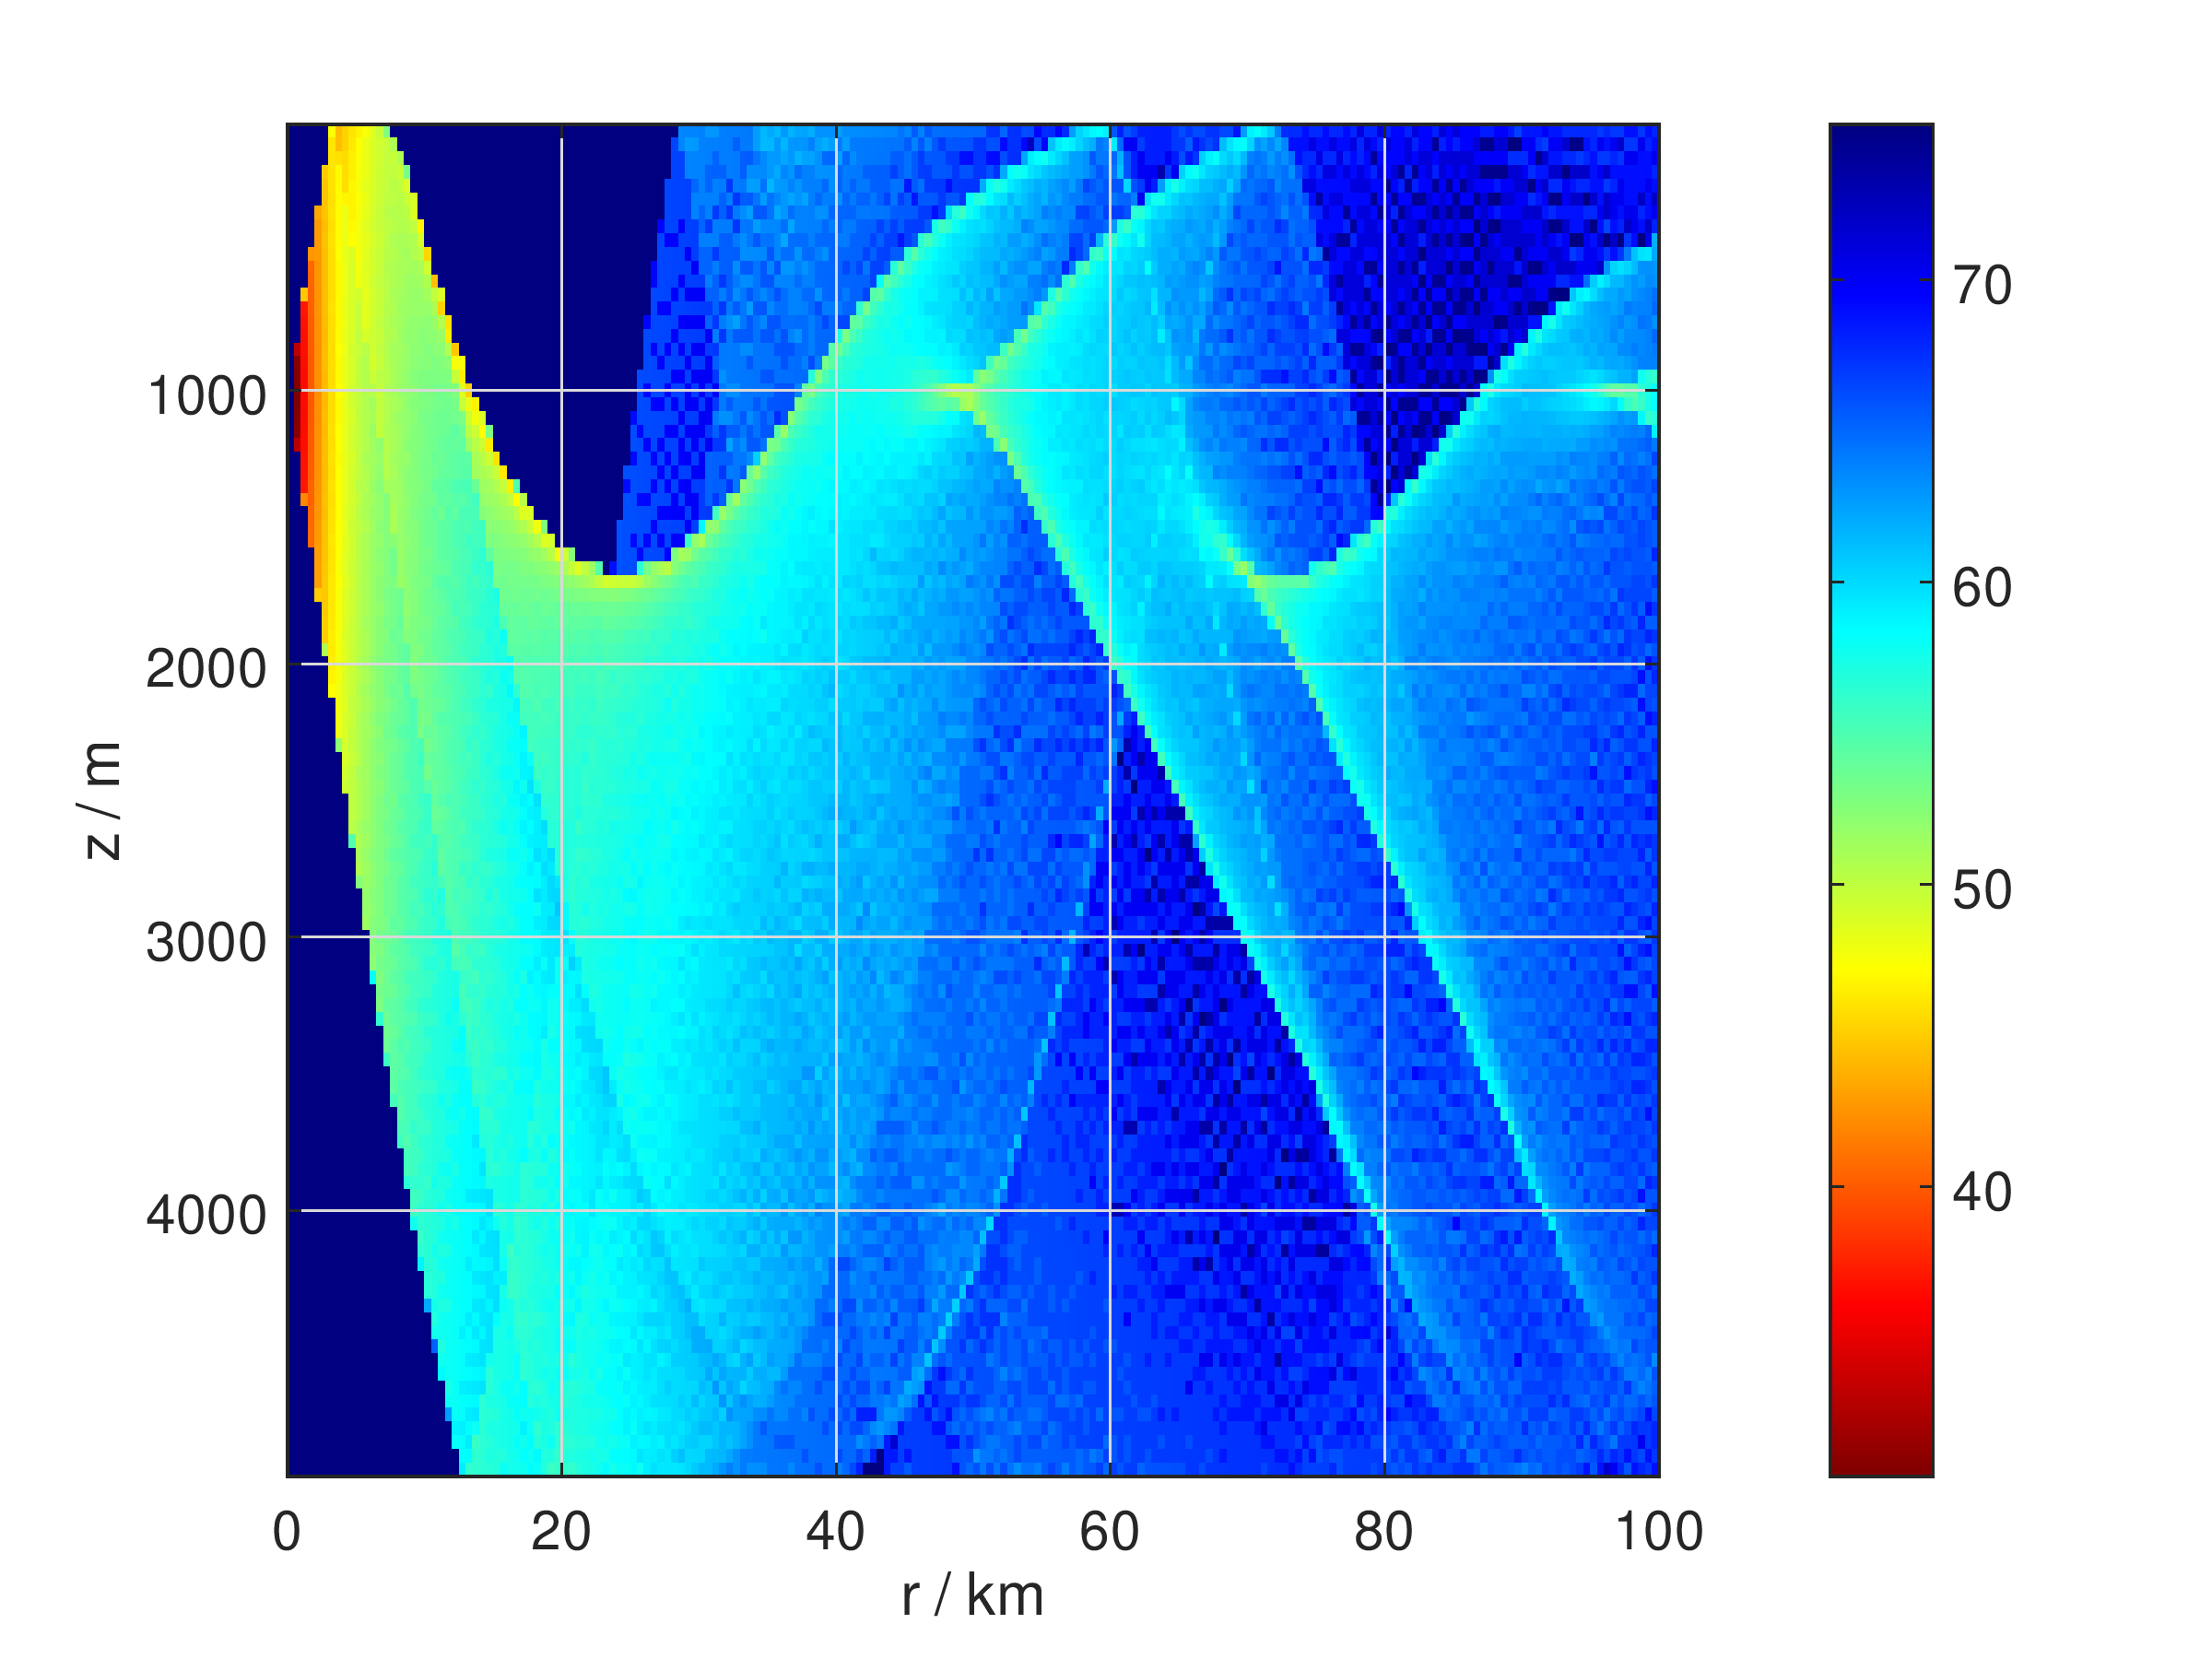
Thanks for answering so fast! Here is a png generated with Matlab (pcolor) as an example for a Cartesian pseudocolor plot. For the radial plot I have no example right now, but it would be similar just using polar coordinates. I suppose if there really is a way to use WCartesianChart then I could just omit the Cartesian axes and add some circles and lines for the polar coordinates on top of the plot...?
| example.png (100 KB) example.png | Example for Cartesian pseudocolor plot |
RE: 2D plot of 3D data (pseudocolor plots) - Added by Roel Standaert over 5 years ago
As you can see, the render function of WCartesianChart is itself virtual and calls other virtual functions. This is so that you can extend it. I think you could reuse the axes from WCartesianChart, and render the data by inserting an extra step or reimplement renderBackground. You can use mapToDevice to figure out where to draw things.
The legend would also need it's own custom implementation.
It's possible that in your case rendering the chart server side will be more efficient. You can try to use setPreferredMethod to set it to PngImage (if you have Wt compiled with raster image support), and see if that yields better performance. That's only usable for non-interactive charts, though.
I don't know if you intend to use Wt's interactive chart features?
RE: 2D plot of 3D data (pseudocolor plots) - Added by Alexandra S over 5 years ago
Thank you! I will try to experiment a bit with that. It might take a while as I don't have much experience with this type of programming. So far my concern was mostly the actual simulations that produce the data and not so much presenting it to the user etc.
Would the second option mean that I have to generate somehow a png from my data server side and send that to the client?
I think the user interaction with the actual plots would probably not be necessary. I have to think about that.
But I think I will start by trying the first option. At least now I know from which class to start!
RE: 2D plot of 3D data (pseudocolor plots) - Added by Alexandra S over 5 years ago
As a first trial, I reimplemented renderBackground like this:
void PseudocolorChart::renderBackground(Wt::WPainter& painter) const {

    Wt::Chart::WCartesianChart::renderBackground(painter);

    auto nx = x_.size();
    auto ny = y_.size();

    painter.save();
    painter.setClipping(true);
    for (auto ii=0; ii<nx-1; ++ii) {
        for (auto jj=0; jj<ny-1; ++jj) {
            Wt::WColor color(colormap_->toColor(value_(ii,jj)));
            painter.fillRect(Wt::WRectF(mapToDevice(x_(ii),y_(jj)), mapToDevice(x_(ii+1),y_(jj+1))), Wt::WBrush(color));
        }

    }
    painter.restore();
}
and my constructor looks like this:
PseudocolorChart::PseudocolorChart(const Eigen::ArrayXd &x, const Eigen::ArrayXd &y, const Eigen::ArrayXXd &value)
    : Wt::Chart::WCartesianChart(Wt::Chart::ChartType::Scatter), x_(x), y_(y), value_(value)
{
    axis(Wt::Chart::Axis::X).setRange(x_(0), x_(x_.size()-1));
    axis(Wt::Chart::Axis::X).setZoomRange(x_(0), x_(x_.size()-1));
    axis(Wt::Chart::Axis::Y).setRange(y_(0), y_(y_.size()-1));
    axis(Wt::Chart::Axis::Y).setZoomRange(y_(0), y_(y_.size()-1));

    setPanEnabled(true);
    setZoomEnabled(true);

    colormap_ = std::make_unique<ColorMapJet>(value_.minCoeff(), value_.maxCoeff(), true, true);
}
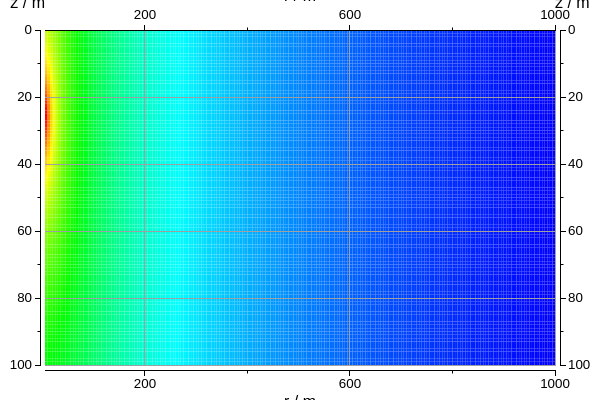
It seems to work somewhat (see attached picture). But when I try to zoom or pan, I see the axes move but the "background" (aka my data) remains unchanged. Am I missing a step?
Is there a better way than fillRect? The edges of the rectangles are visible and it would look much nicer if they weren't.
I am also not sure why my axes labels are cut off but that is probably just some beginner's mistake :(
| canvas.png (60.7 KB) canvas.png |
RE: 2D plot of 3D data (pseudocolor plots) - Added by Alexandra S over 5 years ago
Okay, I shouldn't have posted before having my coffee ;)
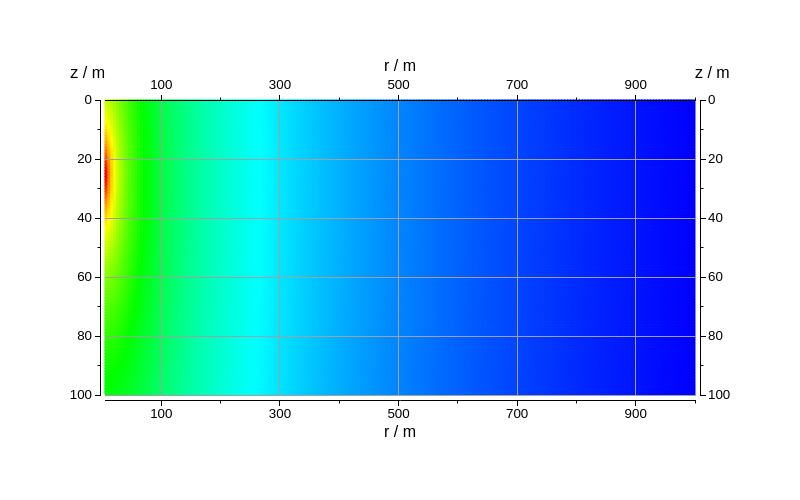
I just answered my last two questions: using drawRect and setPlotAreaPadding gives a much nicer result (see attached pic).
So it just remains the zooming and panning problem...
| canvas.png (158 KB) canvas.png |
RE: 2D plot of 3D data (pseudocolor plots) - Added by Roel Standaert over 5 years ago
The labels are likely cut off because Wt does not measure by default how much space is needed for them. This space is adjustable with setPlotAreaPadding, or you can get it to automatically calculate the padding with setAutoLayoutEnabled.
I see that you did end up enabling zoom and padding. In that case some care should be taken to preserve the dynamic nature of your points. The WRectF(WPointF, WPointF) constructor will use the server-side value, and not take into account the zoom range transform. You could use mapToDeviceWithoutTransform instead, and add the zoom range transform to the resulting rectangle, like this:
void PseudocolorChart::renderBackground(Wt::WPainter& painter) const {

    Wt::Chart::WCartesianChart::renderBackground(painter);

    auto nx = x_.size();
    auto ny = y_.size();

    painter.save();
    painter.setClipping(true);
    for (auto ii=0; ii<nx-1; ++ii) {
        for (auto jj=0; jj<ny-1; ++jj) {
            Wt::WColor color(colormap_->toColor(value_(ii,jj)));
            painter.fillRect(zoomRangeTransform().map(
                               Wt::WRectF(
                                 mapToDeviceWithoutTransform(x_(ii),y_(jj)),
                                 mapToDeviceWithoutTransform(x_(ii+1),y_(jj+1))),
                             Wt::WBrush(color));
        }

    }
    painter.restore();
}
RE: 2D plot of 3D data (pseudocolor plots) - Added by Alexandra S over 5 years ago
Thank you so much!
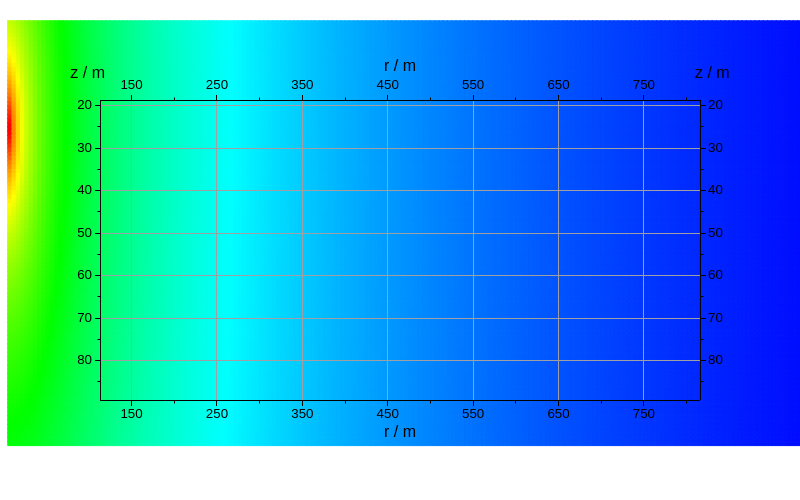
Now it looks like the attached pic when I zoom in. How can I clip the "background" at the axes?
| canvas.png (200 KB) canvas.png |
RE: 2D plot of 3D data (pseudocolor plots) - Added by Roel Standaert over 5 years ago
Ah, I see that the clipping path is not set to the chart area before renderBackground, and there isn't really an exposed way to get it. You can try to reconstruct this clipping path by getting the values at the extremes of the axes and constructing a WRectF out of that. It is set as the clip path in renderOther too, but that is called after everything else in the default implementation of render.
RE: 2D plot of 3D data (pseudocolor plots) - Added by Alexandra S over 5 years ago
Thank you! This seems to do the trick:
auto clippath = Wt::WPainterPath();
    clippath.addRect(zoomRangeTransform().map(
                         Wt::WRectF(
                           mapToDeviceWithoutTransform(x_(0),y_(0)),
                           mapToDeviceWithoutTransform(x_(nx-1),y_(ny-1)))));
    painter.setClipPath(clippath);