Wt WCartesianChart does not show
Added by Kamiel Fokkink over 5 years ago
Hi,
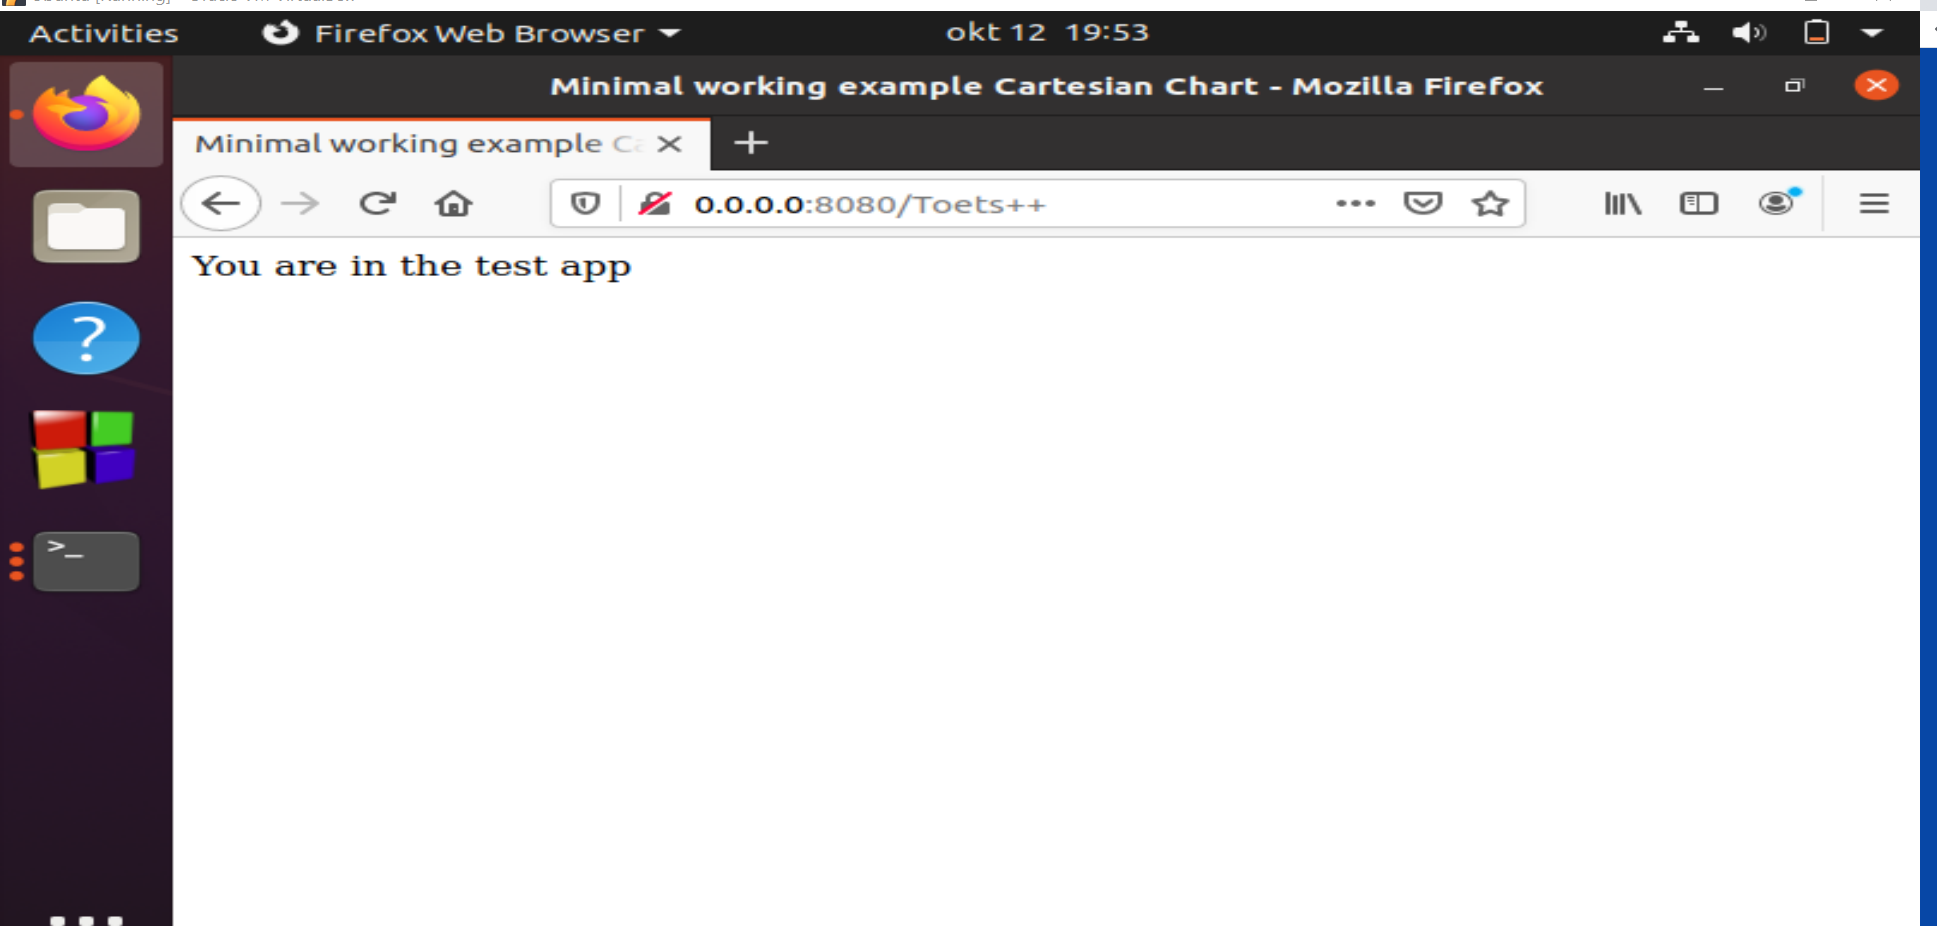
I am attempting to show a bar chart on the screen. I am following the example to make a WCartesianChart as presented in the widget gallery at https://www.webtoolkit.eu/widgets/graphics-charts/category-chart. Instead of reading data from a file, I have the data that I want to plot stored in an object, so I populated a model with datapoints according to the description presented at https://www.webtoolkit.eu/wt/doc/reference/html/classWt_1_1WStandardItemModel.html. I connected the model to the chart, and set an x series and a y data series, also according to the description in the widget gallery. According to the best of my knowledge and based on the examples I saw and read, the attached code should produce a bar graph on the screen. However, this does not happen, there is only an empty screen, the graph does not show.
The code that is attached compiles without errors, and the executable runs just fine, only the graph does not appear on screen. I am quite new to Wt, so it's probably just a simple error, but I have no idea what is going wrong. Any help to enlighten me on this issue would be much appreciated. I just want to create a bar chart with values I have stored in an object (in the included example the values are trivial for simplicity).
Thanks
Replies (2)
RE: Wt WCartesianChart does not show - Added by Roel Standaert over 5 years ago
I think this is a common mistake. WPaintedWidget, and by extension WCartesianChart, has a default size of 0.
This is because instead of having the contents dictate the size (like with a normal WContainerWidget), it's the size of the painted widget that determines how large its contents are.
You can give it a size with resize, or let a layout manager give it a size.
RE: Wt WCartesianChart does not show - Added by Kamiel Fokkink over 5 years ago
Thanks a lot, this solved the issue for me! :)