WCartesionChart Questions
Added by Gerald Brandt almost 5 years ago
Hi,
I have a vector that I'm trying to display in a WCartesionChart, and it seems like Wt is crashing on me.
Can some one quickly show me how to display a vector of data in a Line WCartesioChart?
This is what I'm doing...
    mCPUGraph  = new Wt::Chart::WCartesianChart() ;
    std::unique_ptr<Wt::Chart::WCartesianChart> cpugraph(mCPUGraph) ;
    mCPUGraph->setStyleClass("graph") ;
    mCPUGraph->setTitle("CPU") ;

    slayout->addWidget(std::move(cpugraph), 1, 0) ;
Then in a timer event
                std::shared_ptr<Wt::WAbstractItemModel> model = std::make_shared<Wt::WStandardItemModel>(0, 0) ;

                for(size_t sloop = 0; sloop < mCpuSeries.size(); sloop++)
                {
                    if(sloop > model->rowCount())
                    {
                        model->insertRows(model->rowCount(), 1) ;
                    }
                    model->setData(sloop, 0, dominfo[dloop].cpupercent) ;
                }

                mCPUGraph->setModel(model) ;
                mCPUGraph->setXSeriesColumn(0) ;
                mCPUGraph->setLegendEnabled(true) ;
                mCPUGraph->setZoomEnabled(true) ;
                mCPUGraph->setPanEnabled(true) ;
                mCPUGraph->setAutoLayoutEnabled(true) ;
                mCPUGraph->setType(Wt::Chart::ChartType::Scatter) ;
                mCPUGraph->axis(Wt::Chart::Axis::X).setScale(Wt::Chart::AxisScale::Date) ;

                auto series = std::make_unique<Wt::Chart::WDataSeries>(0, Wt::Chart::SeriesType::Line);
                series->setShadow(Wt::WShadow(3, 3, Wt::WColor(0, 0, 0, 127), 3));
                mCPUGraph->addSeries(std::move(series));
Thanks,
Gerald
Replies (4)
RE: WCartesionChart Questions - Added by Gerald Brandt almost 5 years ago
Oops, sorry. The error I get is: Wt internal error; code: undefined, description: Wt4_5_0.$(...).wtJSObj is undefined
Gerald
RE: WCartesionChart Questions - Added by Gerald Brandt almost 5 years ago
So, I tried to get to fancy, I guess. I took out the pan and zoom, and no more crash.
Now, I can see my graph changing as I add items to it (the X axis updates), but I can't see my data being plotted.
Gerald
RE: WCartesionChart Questions - Added by Korneel Dumon almost 5 years ago
Hi Gerald,
your dataseries seems to use same column as the x series (column 0), maybe this is the problem.
RE: WCartesionChart Questions - Added by Gerald Brandt almost 5 years ago
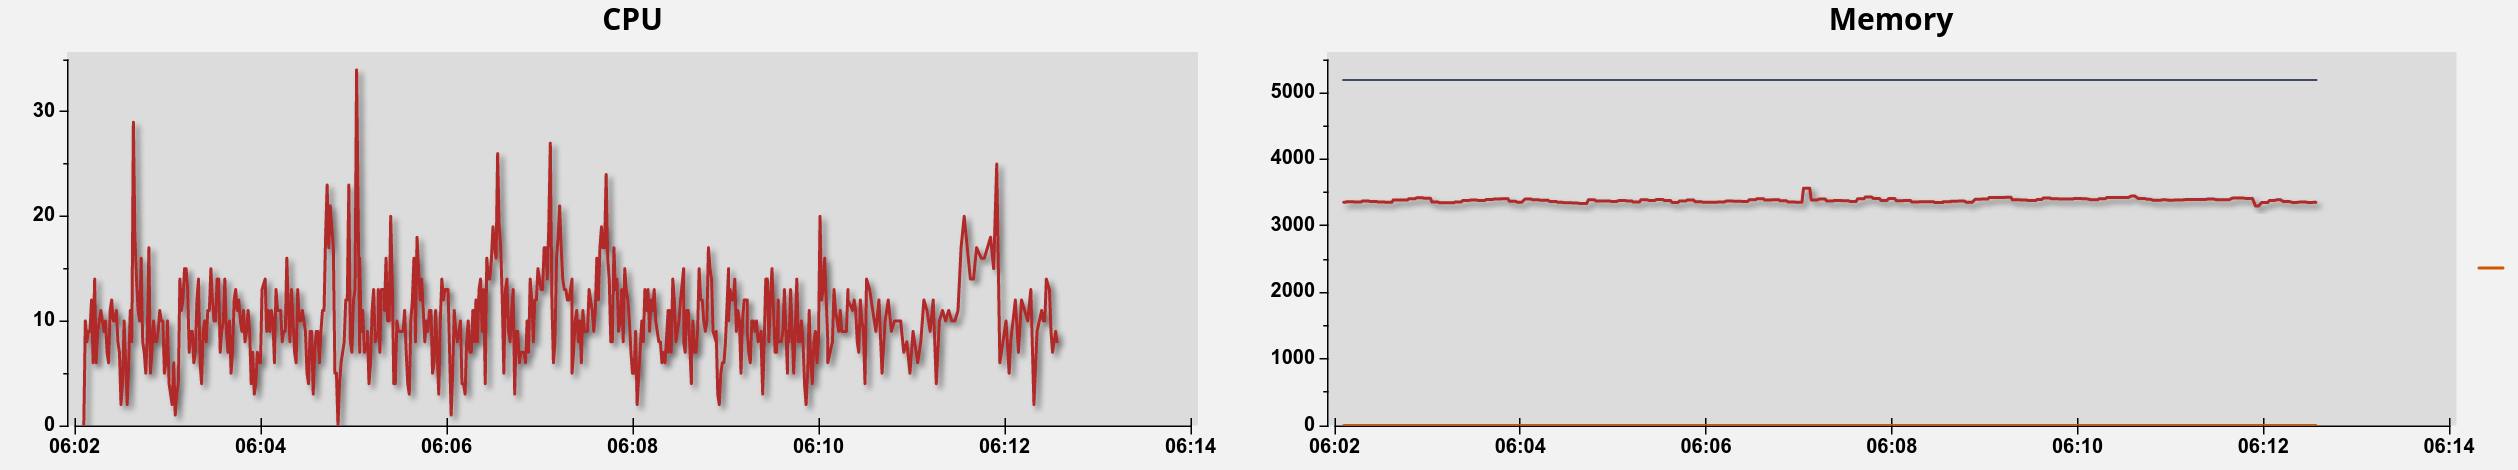
Yeah, I had some issues with that. Even after changing that, so data was displayed, even though the chart x axis grew as data was added.
My solution was to preallocate the item model...
std::shared_ptrWt::WAbstractItemModel model = std::make_sharedWt::WStandardItemModel(mCpuSeries.size(), 2) ;