Actions
Bug #13510
closedFollowing the curve in WCartesianChart with DateTime data doesn't produce DateTime data
Start date:
02/11/2025
Due date:
% Done:
100%
Estimated time:
Description
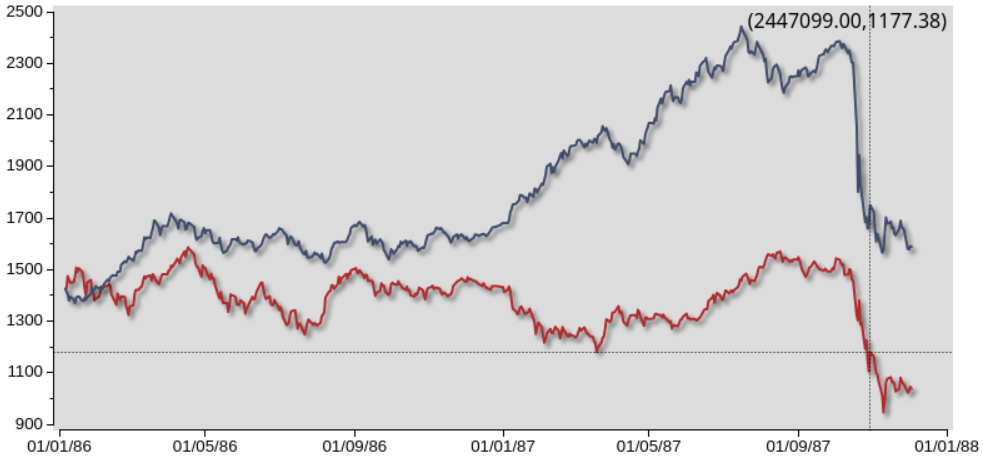
When WCartesianChart::setFollowCurve() is called, the curve can be hovered over with the mouse. It then displays data on the hovered over point.
This does not correctly work for all types of data, as it seems to always interpret is as a double.
See the screenshot:

The data in the x-axis is a date, and the label should display that data as a date.
Note: this comes from the widget gallery (https://www.webtoolkit.eu/widgets/graphics-charts/scatter-plot), where chart->setFollowCurve(2); is added to the last example.
Files
Updated by Romain Mardulyn 12 months ago
- Status changed from New to InProgress
- Assignee set to Romain Mardulyn
Updated by Romain Mardulyn 12 months ago
- Status changed from InProgress to Review
- Assignee deleted (
Romain Mardulyn)
Updated by Matthias Van Ceulebroeck 11 months ago
- Assignee set to Matthias Van Ceulebroeck
Updated by Matthias Van Ceulebroeck 11 months ago
- Status changed from Review to Implemented @Emweb
- Assignee changed from Matthias Van Ceulebroeck to Romain Mardulyn
- % Done changed from 0 to 100
Updated by Matthias Van Ceulebroeck 11 months ago
- Status changed from Implemented @Emweb to Implemented @Test
Updated by Matthias Van Ceulebroeck 10 months ago
- Status changed from Implemented @Test to Closed
Actions