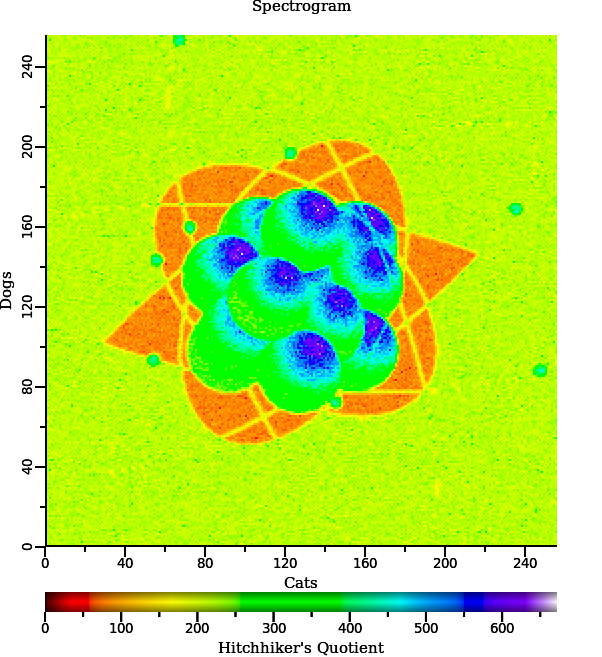
Feature #511
openAdd WSpectrogramChart
30%
Description
Wt is currently lacking a Spectrogram Chart
In addition, the Cartesian chart is tightly coupled with the axis.
A design that entertains an API like that of Qwt would work well.
I provide what I was able to produce in this regard, unfortunately I am out of time and will be unable to work on it further for some time.
While the implementation is incomplete, it is functional.
I attempted to follow Wt naming conventions, though I am sure something is probably wrong. Please modify this in any way you see fit.
For the future:
- Role based data
> To allow for location specific tip text - Finish the log10 ScaleEngine
- Port the scale system to WCartesanChart
> After the axis API matures
Files

Updated by Thomas Suckow over 15 years ago
Also, the Z-axis is currently a 1px tall image that is generated then scaled in the browser. This should probably be changed as some browsers apply an effect to it as seen in the preview (Firefox).
Updated by Koen Deforche over 15 years ago
Hey Thomas,
This looks awesome !
Regards,
koen