Memory is increasing for each refresh in browser.
Added by Naveen A.N over 12 years ago
Hello,
For each refresh in the browser i can see the memory is increasing.
I have checked all my code there is no issue. Even a empty request handler gives the same issue.
This is my example code.
I am using the version 3.3.0
        Wt::WServer server(argv[0]);
        server.setServerConfiguration(argc, argv, WTHTTP_CONFIGURATION);
        Wt::log("info")<<"Server is starting ....";
        TestHandler handler;
        server.addResource(&handler,"/");
        if (server.start()) {
            Wt::WServer::waitForShutdown(argv[0]);
            server.stop();
        }
Replies (5)
RE: Memory is increasing for each refresh in browser. - Added by Wim Dumon over 12 years ago
Hello Naveen,
How do you measure memory consumption? Can you pinpoint the origin of the leak, through tools like valgrind?
Note that the reported memory usage by the OS does not directly point to a memory leak in your application, your malloc implementation may keep a pool of unallocated memory for e.g. performance considerations.
BR,
Wim.
RE: Memory is increasing for each refresh in browser. - Added by Naveen A.N over 12 years ago
Hello Wim,
Thanks for the quick reply,
I am not much familiar with valgrind.
I use the system monitor to check the memory rate while each refresh.
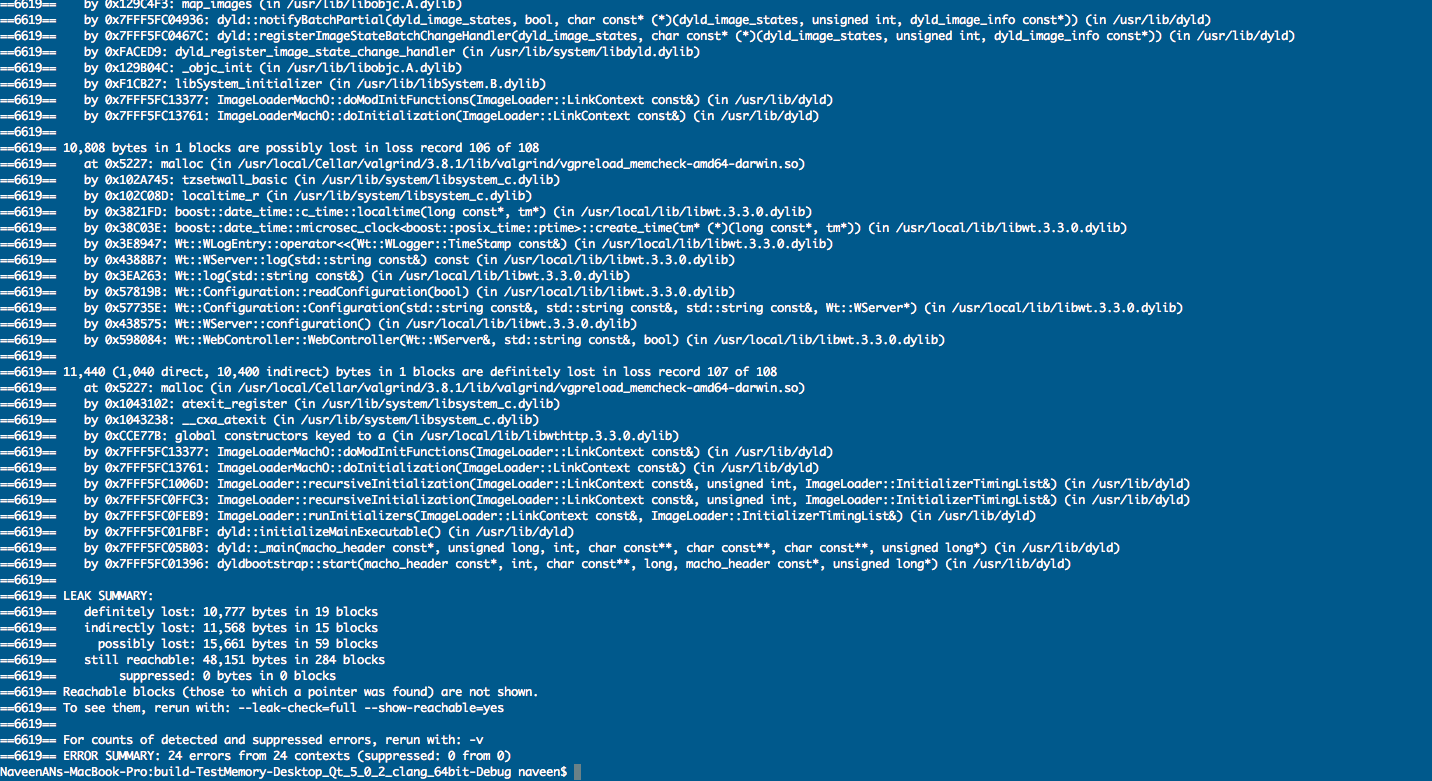
And i tested the same code with valgrid and sharing the screen shot please have a look.
Naveen.A.N
RE: Memory is increasing for each refresh in browser. - Added by Koen Deforche over 12 years ago
Hey,
That looks suspicious. Could you post the complete test case?
We do extensive checking for memory leaks in Wt and I would be surprised if it's an issue with Wt though. How do you terminate your application as it seems that the valgrind trace indicates not a clean shutdown?
Regards,
koen
RE: Memory is increasing for each refresh in browser. - Added by Naveen A.N over 12 years ago
Hello Koen,
Please find the attachment of full log of valgrind.
And the code i used. Obviously there is nothing in the code.
While i run valgrind ---leak-check=full ./TestMemory ---docroot . ---http-address 0.0.0.0 ---http-port 8090 ---approot .
It automatically shutdown the server.
Naveen.A.N
| Testmemory.zip (2.03 KB) Testmemory.zip | |||
| log.txt (33.5 KB) log.txt |
RE: Memory is increasing for each refresh in browser. - Added by Koen Deforche over 12 years ago
Hey,
I was already wonder whether I should upgrade valgrind/macosx build tools: valgrind does not work well on MacOSX with a Wt application, because of the:
sigwait() error: Function not implemented
It's a known problem: https://bugs.kde.org/show_bug.cgi?id=211372
This happens somewhere in the wthttpd server and is harmless to comment out, and that's what I do when I desperate to get valgrind going on MacOSX. But the whole valgrind trace is not to be trusted because of this.
I ran your test case and it runs fine:
$ valgrind --leak-check=full test.wt
==29387== Memcheck, a memory error detector
==29387== Copyright (C) 2002-2011, and GNU GPL'd, by Julian Seward et al.
==29387== Using Valgrind-3.7.0 and LibVEX; rerun with -h for copyright info
==29387== Command: ../../../build/test/interactive/test/test.wt
==29387==
[2013-Jul-10 16:39:00.588813] 29387 - [info] "config: reading Wt config file: /etc/wt/wt_config.xml (location = 'test.wt')"
[2013-Jul-10 16:39:01.183379] 29387 - [info] "wthttp: reading wthttpd configuration from: /etc/wt/wthttpd"
[2013-Jul-10 16:39:01.195940] 29387 - [info] "Server is starting ...."
[2013-Jul-10 16:39:01.199660] 29387 - [info] "WServer/wthttp: initializing built-in wthttpd"
[2013-Jul-10 16:39:01.453908] 29387 - [info] "wthttp: started server: http://0.0.0.0:9090"
127.0.0.1 - - [2013-Jul-10 16:39:03.959478] "GET / HTTP/1.1" 404 85
127.0.0.1 - - [2013-Jul-10 16:39:04.042168] "GET /favicon.ico HTTP/1.1" 404 85
^C[2013-Jul-10 16:39:05.065629] 29387 - [info] "WebController: shutdown: stopping sessions."
[2013-Jul-10 16:39:05.080541] 29387 - [info] "WServer/wthttp: Shutdown: stopping web server."
==29387==
==29387== HEAP SUMMARY:
==29387==     in use at exit: 5,072 bytes in 12 blocks
==29387==   total heap usage: 3,235 allocs, 3,223 frees, 559,909 bytes allocated
==29387==
==29387== LEAK SUMMARY:
==29387==    definitely lost: 0 bytes in 0 blocks
==29387==    indirectly lost: 0 bytes in 0 blocks
==29387==      possibly lost: 0 bytes in 0 blocks
==29387==    still reachable: 5,072 bytes in 12 blocks
==29387==         suppressed: 0 bytes in 0 blocks
==29387== Reachable blocks (those to which a pointer was found) are not shown.
==29387== To see them, rerun with: --leak-check=full --show-reachable=yes
==29387==
==29387== For counts of detected and suppressed errors, rerun with: -v
==29387== ERROR SUMMARY: 0 errors from 0 contexts (suppressed: 2 from 2)
I also modified to include the test handler:
$ valgrind --leak-check=full test.wt
==29567== Memcheck, a memory error detector
==29567== Copyright (C) 2002-2011, and GNU GPL'd, by Julian Seward et al.
==29567== Using Valgrind-3.7.0 and LibVEX; rerun with -h for copyright info
==29567== Command: ../../../build/test/interactive/test/test.wt
==29567==
[2013-Jul-10 16:40:32.237790] 29567 - [info] "config: reading Wt config file: /etc/wt/wt_config.xml (location = 'test.wt')"
[2013-Jul-10 16:40:32.825558] 29567 - [info] "wthttp: reading wthttpd configuration from: /etc/wt/wthttpd"
[2013-Jul-10 16:40:32.837337] 29567 - [info] "Server is starting ...."
[2013-Jul-10 16:40:32.902027] 29567 - [info] "WServer/wthttp: initializing built-in wthttpd"
[2013-Jul-10 16:40:33.153762] 29567 - [info] "wthttp: started server: http://0.0.0.0:9090"
127.0.0.1 - - [2013-Jul-10 16:40:35.388844] "GET / HTTP/1.1" 200 0
[2013-Jul-10 16:40:35.415294] 29567 - [info] "WebRequest: took 450.673ms"
127.0.0.1 - - [2013-Jul-10 16:40:35.537315] "GET /favicon.ico HTTP/1.1" 404 85
127.0.0.1 - - [2013-Jul-10 16:40:39.724487] "GET / HTTP/1.1" 200 0
[2013-Jul-10 16:40:39.725857] 29567 - [info] "WebRequest: took 28.136ms"
127.0.0.1 - - [2013-Jul-10 16:40:39.757667] "GET /favicon.ico HTTP/1.1" 404 85
127.0.0.1 - - [2013-Jul-10 16:40:40.845423] "GET / HTTP/1.1" 200 0
[2013-Jul-10 16:40:40.847063] 29567 - [info] "WebRequest: took 20.701ms"
127.0.0.1 - - [2013-Jul-10 16:40:40.886117] "GET /favicon.ico HTTP/1.1" 404 85
127.0.0.1 - - [2013-Jul-10 16:40:41.530305] "GET / HTTP/1.1" 200 0
[2013-Jul-10 16:40:41.532135] 29567 - [info] "WebRequest: took 20.971ms"
127.0.0.1 - - [2013-Jul-10 16:40:41.570355] "GET /favicon.ico HTTP/1.1" 404 85
127.0.0.1 - - [2013-Jul-10 16:40:42.043907] "GET / HTTP/1.1" 200 0
[2013-Jul-10 16:40:42.045613] 29567 - [info] "WebRequest: took 28.268ms"
127.0.0.1 - - [2013-Jul-10 16:40:42.078288] "GET /favicon.ico HTTP/1.1" 404 85
127.0.0.1 - - [2013-Jul-10 16:40:42.513432] "GET / HTTP/1.1" 200 0
[2013-Jul-10 16:40:42.515357] 29567 - [info] "WebRequest: took 20.002ms"
127.0.0.1 - - [2013-Jul-10 16:40:42.561328] "GET /favicon.ico HTTP/1.1" 404 85
127.0.0.1 - - [2013-Jul-10 16:40:42.914758] "GET / HTTP/1.1" 200 0
[2013-Jul-10 16:40:42.916089] 29567 - [info] "WebRequest: took 18.274ms"
127.0.0.1 - - [2013-Jul-10 16:40:42.961864] "GET /favicon.ico HTTP/1.1" 404 85
127.0.0.1 - - [2013-Jul-10 16:40:43.253369] "GET / HTTP/1.1" 200 0
[2013-Jul-10 16:40:43.255433] 29567 - [info] "WebRequest: took 21.787ms"
127.0.0.1 - - [2013-Jul-10 16:40:43.294111] "GET /favicon.ico HTTP/1.1" 404 85
127.0.0.1 - - [2013-Jul-10 16:40:43.554163] "GET / HTTP/1.1" 200 0
[2013-Jul-10 16:40:43.556426] 29567 - [info] "WebRequest: took 21.182ms"
127.0.0.1 - - [2013-Jul-10 16:40:43.597949] "GET /favicon.ico HTTP/1.1" 404 85
127.0.0.1 - - [2013-Jul-10 16:40:44.079039] "GET / HTTP/1.1" 200 0
[2013-Jul-10 16:40:44.080663] 29567 - [info] "WebRequest: took 22.507ms"
127.0.0.1 - - [2013-Jul-10 16:40:44.120257] "GET /favicon.ico HTTP/1.1" 404 85
127.0.0.1 - - [2013-Jul-10 16:40:44.502850] "GET / HTTP/1.1" 200 0
[2013-Jul-10 16:40:44.505003] 29567 - [info] "WebRequest: took 19.286ms"
127.0.0.1 - - [2013-Jul-10 16:40:44.553419] "GET /favicon.ico HTTP/1.1" 404 85
127.0.0.1 - - [2013-Jul-10 16:40:44.862824] "GET / HTTP/1.1" 200 0
[2013-Jul-10 16:40:44.864627] 29567 - [info] "WebRequest: took 20.309ms"
127.0.0.1 - - [2013-Jul-10 16:40:44.912851] "GET /favicon.ico HTTP/1.1" 404 85
127.0.0.1 - - [2013-Jul-10 16:40:45.190764] "GET / HTTP/1.1" 200 0
[2013-Jul-10 16:40:45.194305] 29567 - [info] "WebRequest: took 28.417ms"
127.0.0.1 - - [2013-Jul-10 16:40:45.225316] "GET /favicon.ico HTTP/1.1" 404 85
10.1.0.34 - - [2013-Jul-10 16:40:45.433994] "POST /widgets?wtd=1PIWqlFs6NLxZAuj HTTP/1.1" 404 85
^C[2013-Jul-10 16:40:46.874550] 29567 - [info] "WebController: shutdown: stopping sessions."
[2013-Jul-10 16:40:46.888975] 29567 - [info] "WServer/wthttp: Shutdown: stopping web server."
==29567==
==29567== HEAP SUMMARY:
==29567==     in use at exit: 5,072 bytes in 12 blocks
==29567==   total heap usage: 13,869 allocs, 13,857 frees, 2,684,303 bytes allocated
==29567==
==29567== LEAK SUMMARY:
==29567==    definitely lost: 0 bytes in 0 blocks
==29567==    indirectly lost: 0 bytes in 0 blocks
==29567==      possibly lost: 0 bytes in 0 blocks
==29567==    still reachable: 5,072 bytes in 12 blocks
==29567==         suppressed: 0 bytes in 0 blocks
==29567== Reachable blocks (those to which a pointer was found) are not shown.
==29567== To see them, rerun with: --leak-check=full --show-reachable=yes
==29567==
==29567== For counts of detected and suppressed errors, rerun with: -v
==29567== ERROR SUMMARY: 0 errors from 0 contexts (suppressed: 2 from 2)
The 12 blocks that are still reachable are somewhere in global constructors in libraries used by Wt, these do not increase over time.
So I agree with Wim that it isn't certain (or rather suspect) that this actually leaks memory on your system, or if it does, it is related to Wt?
Regards,
koen